Home Tab : Viewing the Transaction Summary Graph

Viewing the Transaction Summary Graph

The color-coded status graph on the Home tab shows the type, status, and number of transactions for your account. Each type of document is represented by a different color. For example, blue-green might represent all invoice transactions.

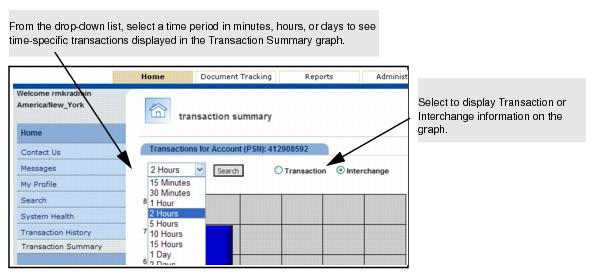
To display documents for a specific time period

1
2
Click Search.

Your time-specific documents display in the Transaction Summary graph.


View or print a User Guide PDF


© 2016 GXS, Inc.